- If you need to check the CPU temperature in Windows 10 and 11 there are tons of free simple utilities you can use.
- Whether you want to check the current CPU temperature or the temperature history there’s a free app to help you do that.
- In this article, you’ll learn about three free options: Core Temp, HWMonitor, and HWiNFO.
Windows 11doesn’t include CPU temperature monitoring in the Settings app, or the Task Manager. You can use free utilities such as Core Temp, HWMonitor, HWiNFO for continuous monitoring.
If you own a modern computer you don’t have to constantly monitor temperatures as the new components are designed to check themselves out and slow down in case of overheating.
With adequate cooling, they will also boost over the baseline specs in order to increase performance.
That being said, it’s important to check CPU, GPU, SSD temperatures, and other sensible components, at least in the first few days after you buy a new PC or laptop.
This way you could make sure there are no manufacturing or assembly problems. These can cause (sometimes) unseen issues which result in not getting the performance you paid for. This is the best-case scenario. Worst case, you’ll be degrading your components faster.
Personally, I do check regularly my PC temps, especially when I know I haven’t cleaned it for dust in a while, in the summer, or when the placebo hits and I get the impression the PC is not fast “as it was before”. Maybe I’m just looking for a reason to upgrade, who knows?
Anyway, in this article I’m going to show you how to check the CPU temperature in Windows 10 and 11. Unlike the GPU temperature, which is easy to check in Windows 11, directly from the Task Manager, and the SSD temperature reading available in the Settings, when it comes to the CPU you will need to install a third-party app.
So no, it is not possible to check CPU temperature in Windows 11 without software. Maybe in a future update, Microsoft will add the CPU temperature monitoring option in the Task Manager, as it did with the GPU temperature.
Anyway, here are three solutions to check your CPU temperature in Windows 10 and 11. I’ve ranked them from simple to complex.
CONTENTS
Easy Solution: Core Temp for Current CPU Temperature in System Tray
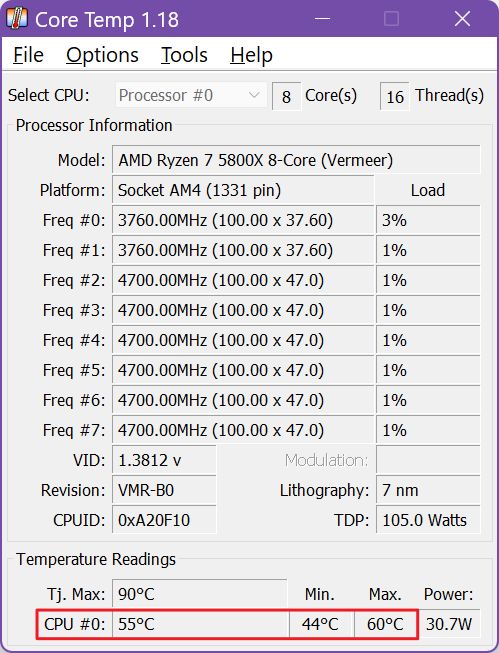
If you don’t need something fancy I recommend Core Temp. Launch the program and you’ll see the most basic stats for your CPU in the main Core Temp window:
- CPU name and platform
- Current Frequency and Load
- Maximum allowed temperature (Tj. Max of 90 degrees Celsius for my AMD Ryzen 5800X)
- Current temperature and power plus min and max temperatures since the app is running.
Once you start Core Temp the current CPU temperature is automatically displayed in the Windows System tray notification area.

By default, you will see a temperature for each detected CPU core. If you mingle with Core Temp settings it’s possible to only display one temperature (easier to read). You can also add CPU Frequency, Load, and RAM utilization in the System Tray.
I think that for most users, Core Temp is enough.
More Details: HWMonitor for Current, Min, and Max CPU temperature
If you want to step up a bit in options go for HWMonitor. You get a bit more details for the CPU, while also having the option to monitor all the other system components: motherboard, fans, graphics card, and storage units.
The CPU temperatures are found in your Motherboard > Temperatures > CPU and in the CPU > Temperatures sections. The Motherboard is the first section, with the name replaced by the make and model, while the CPU section, the second, has the name replaced with the CPU make and model designation.
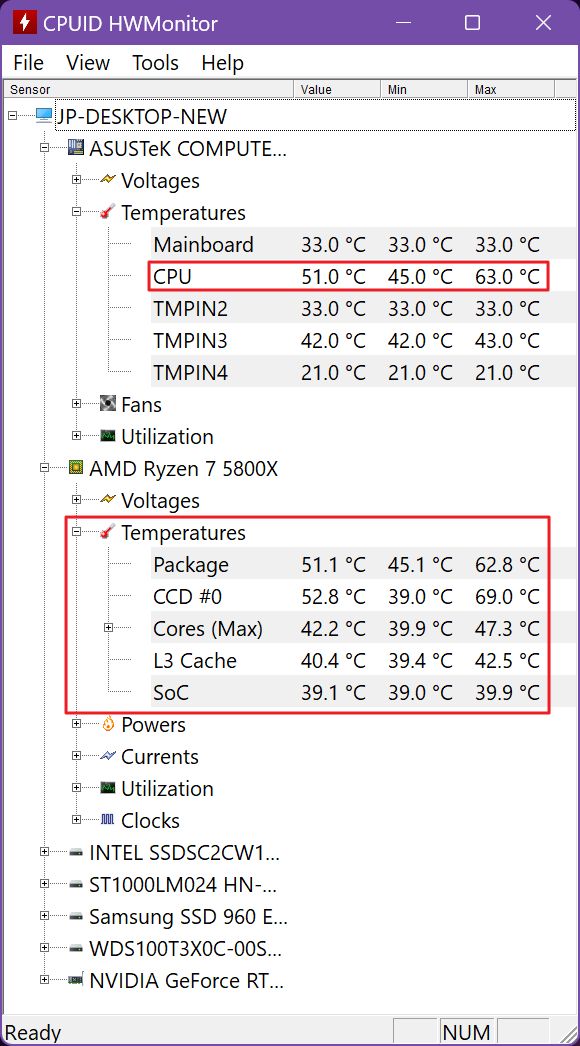
Besides the current values, you also get minimum and maximum values since HWMonitors was launched. There are no options to add monitors to the system tray or overlay them on the desktop, or in games.
Advanced Monitoring: HWiNFO for all CPU Parameters, Min, Max, Average, and Temperature Graphs
HWiNFO is for those who are not afraid of walls of text. The app is capable of polling a lot of system sensors. It’s impossible to know what everything means, but you can hover the cursor over each line and get a useful tooltip.
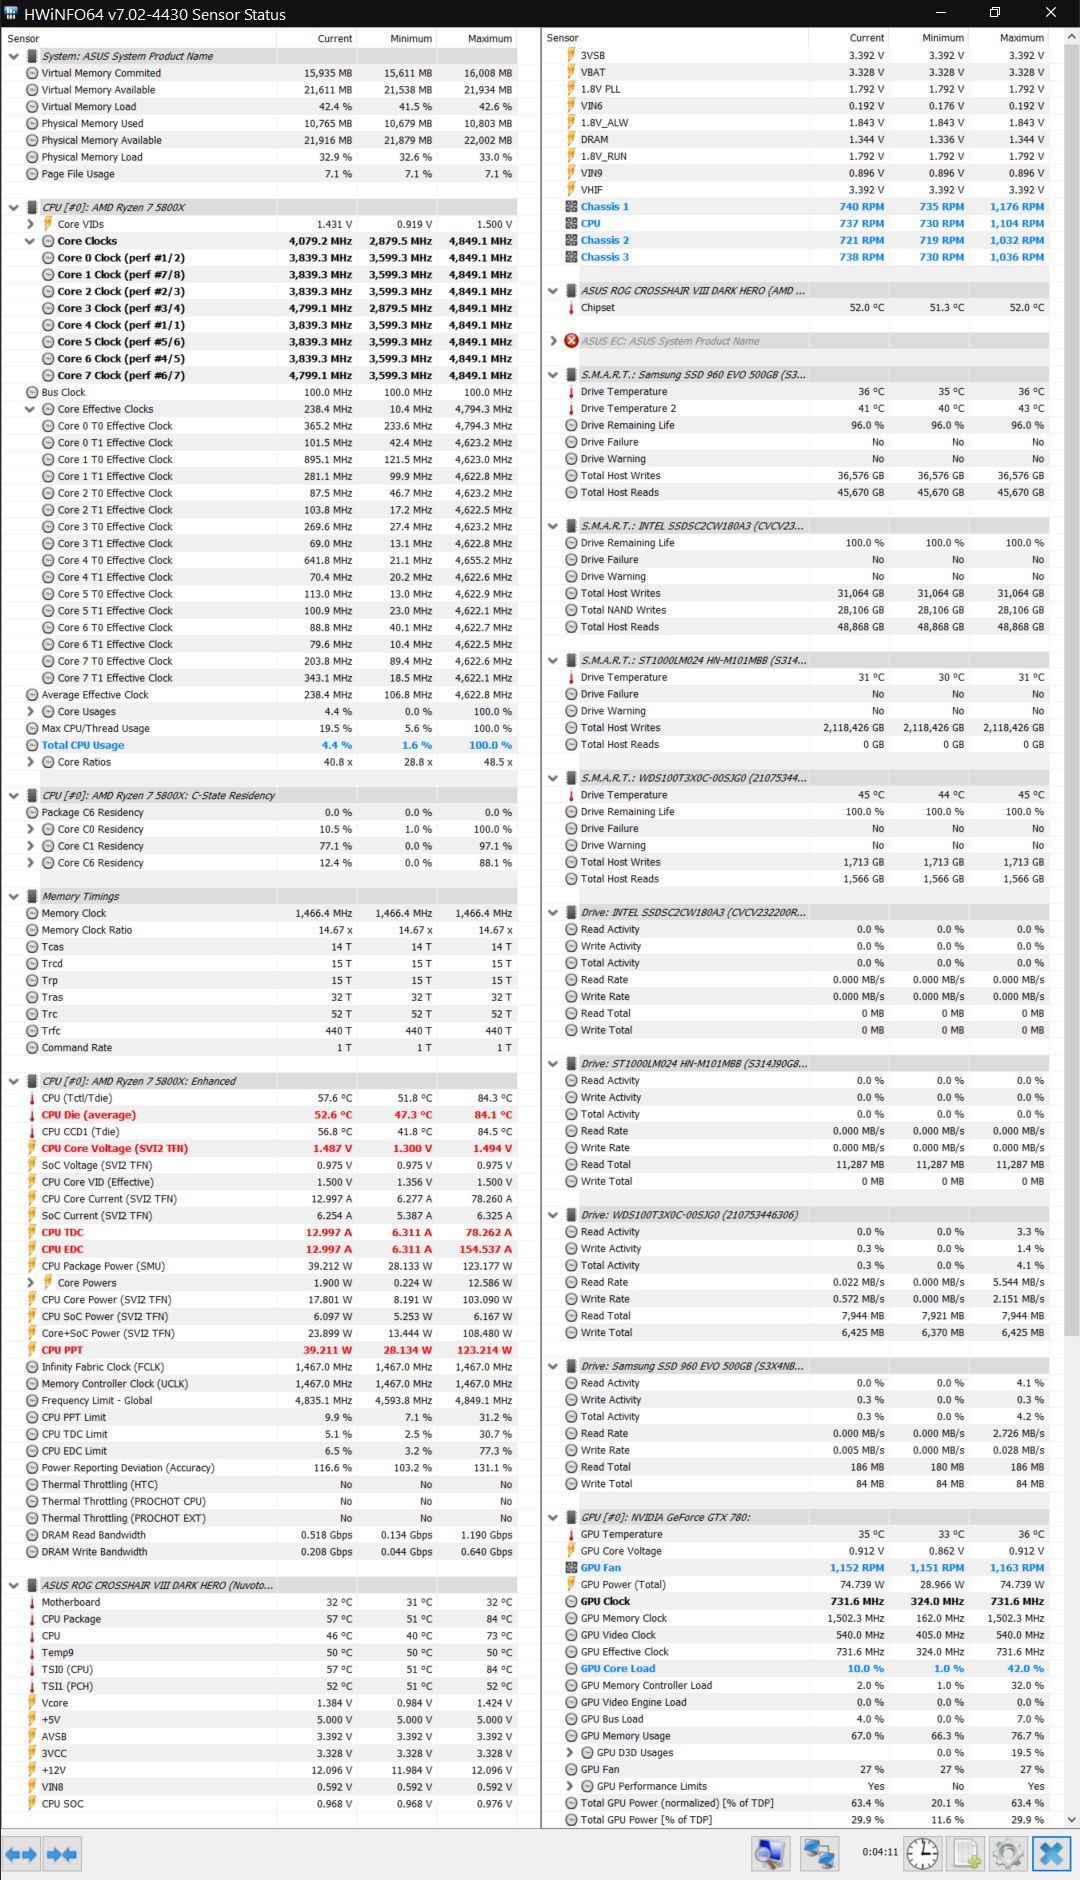
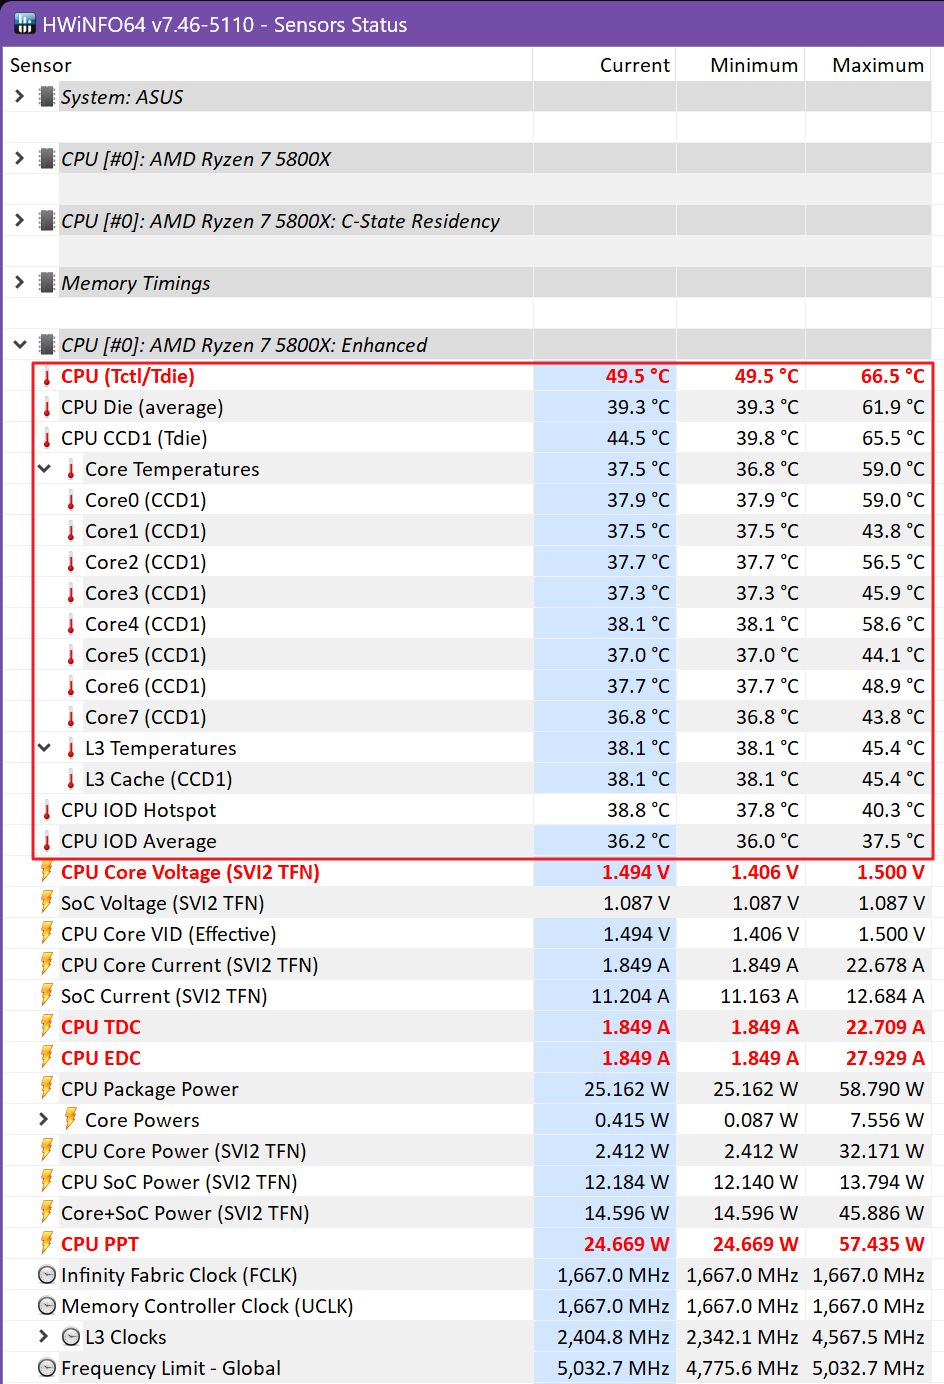
Anyway, the CPU Enhanced section is the one you need. The section name also includes the CPU make and model. Here you’ll find detailed temperatures for the CPU, its cores, L3 cache, hotspot, average, IO die, and so on.
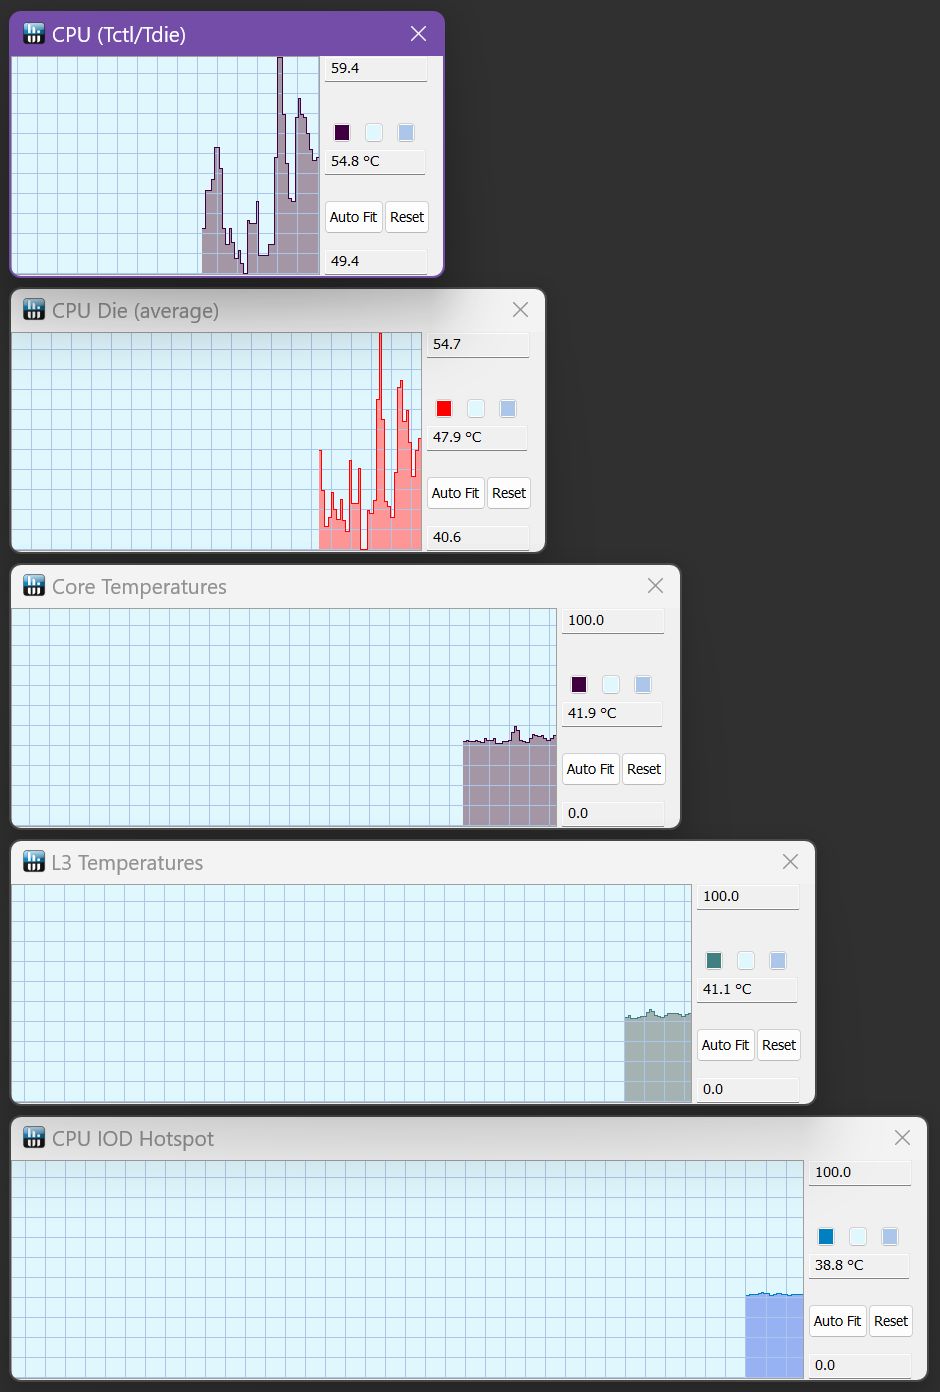
If you right-click on each line you can pull out graphs that will show as movable mini-windows on your desktop. Neat, if you need to monitor stats while you run specific programs to heat up the CPU (or other components).
Right-clicking again on any sensor in HWiNFO will present the option to “Add to tray” that sensor.
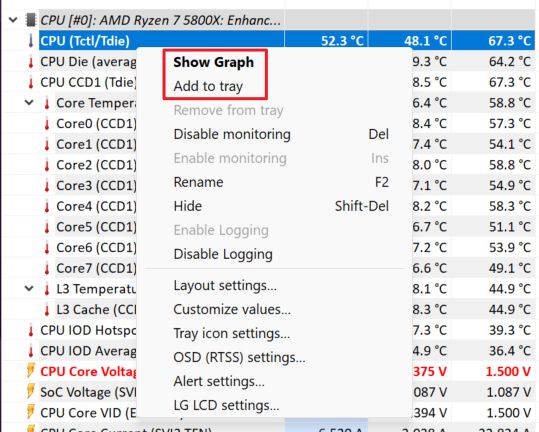
Don’t go overboard with this, as you will surely clutter the System Tray to the point you won’t know what temperature you’re monitoring. Yes, you can customize each icon (text and background color) and you can hover over the icon, but the whole point is to see everything at a glance, right?
I would just add the main CPU Die average temperature.

HWiNFO can also display averages in the period the app is open. Dig into the settings cogwheel icon to access the option. Here you can also configure the app to show stats directly in the System Tray, just like Core Temp does.
Not only that, but HWiNFO can send the info it collects directly to programs like Rainmeter, which can be used to display the info directly on your desktop, or to MSI Afterburner, which can overlay the stats in the corner of the screen when you’re gaming.
HWiNFO is not necessarily hard to use, but it’s not what I would call intuitive. The upside is incredible flexibility when it comes to monitoring your PC vitals.
What about you, what utility are you using to monitor your PC? Let me know in the comments.
Recommended read: 5 free utilities you can use to monitor your PC in detail, from simple to very advanced.
Frequently asked questions
Recent CPUs have a maximum temperature that will not cause long-term damage (according to the manufacturer) around 90-95 degrees Celsius (194 – 203 Fahrenheit).
Personally, I think anything above 80 degrees C (176 F) is too high.
Sensor checks are performed automatically to keep the temperature in check, at the expense of performance. An overheating CPU will throttle down, lowering frequency, power consumption, and ultimately the temperature.
Also, recent CPUs are designed to run at the maximum allowed temperature, frequency, and power. Hitting one of these limits will automatically throttle the other limits.
If the CPU doesn’t get enough cooling you will lose performance due to the lower operational frequency it will run at.


