- If you need to check the GPU temperature in Windows 11 there’s a simple way to do it without having to install any third-party utility.
- Learn how to use the Task Manager in Windows 11 to check the current GPU temperature.
- For detailed information about your graphic card, including evolution graphs, GPU-Z is one of the free utilities you should use.
Windows 11 can monitor the GPU temperature directly in the Task Manager: Performance > GPU > GPU temperature. Free utilities such as GPU-Z and HWiNFO can be used for continuous monitoring.
Keeping an eye on your main components’ temperature is not something many users are willing to do unless there’s a problem. Modern hardware is mostly capable of keeping itself safe by throttling down, so you shouldn’t have issues that result in hardware failures.
That doesn’t mean you shouldn’t check the CPU and GPU temperatures from time to time, just to ensure they’re running normally, aka can take full advantage of their maximum speed. If your system is overheating it will slow down and you may not be aware.
Now that you know why it’s important to check temperatures at least occasionally, let’s see how you do that for the graphics card (GPU) in Windows.
Use Task Manager to Check Current GPU Temperature in Windows 11
One of the improvements you’ll see in the Windows 11 Task Manager app is the addition of a GPU temperature reading in the Performance section. I find it weird that Microsoft didn’t do the same thing with the CPU temperature (but you can also use free apps to check the CPU temperature in Windows). I guess they wanted to keep that as a reason to upgrade to Windows 12.
They did add a temperature reading for SSDs, but hid it in the Settings app, to make things even more confusing.
Anyway, here’s how to read the GPU temperature in Task Manager in Windows 11. No need to install anything.
1. Launch the Task Manager. The easiest way is to use the Ctrl + Shift + Esc keyboard shortcut.
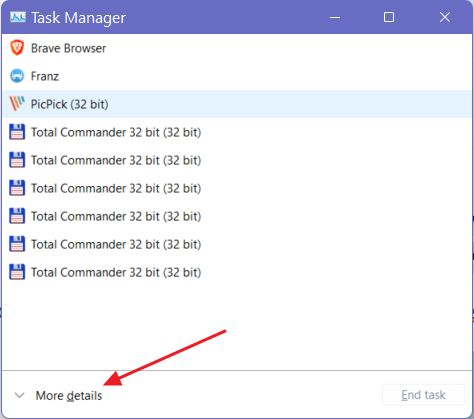
2. If it’s the first time you open Task Manager you have to click on the More Details link to expand the window to full size.
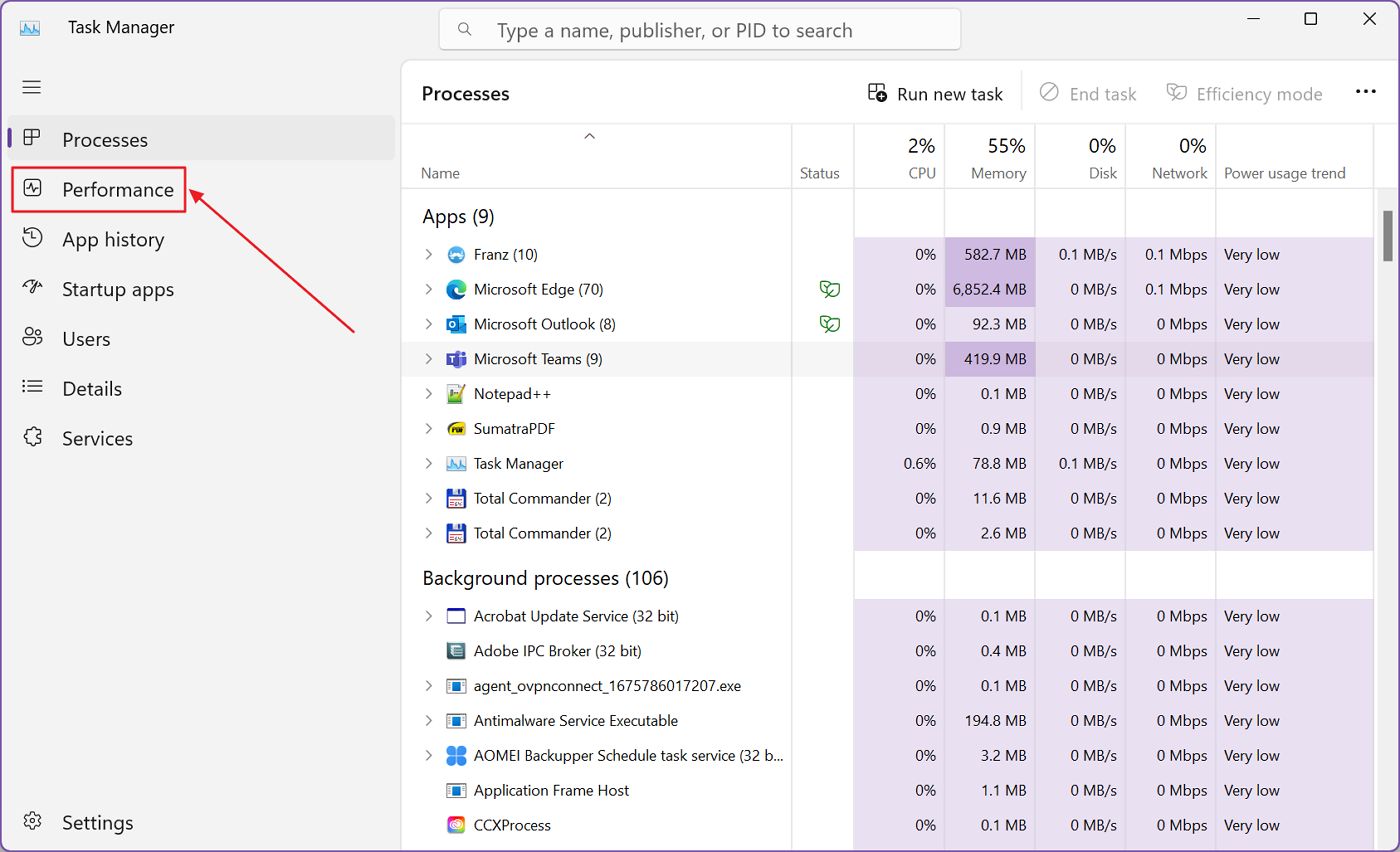
3. With the Task Manager in detailed mode make sure the app window is large enough so that the left side menu is expanded to show icons and text. Select the Performance section.
4. With the Performance section open, scroll through the middle section until you see GPU 0 and GPU 1 (if you have more than one GPU in your system).
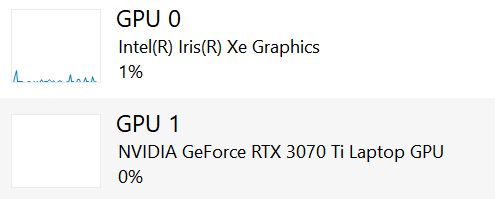
Click on each of them to reveal the GPU details.
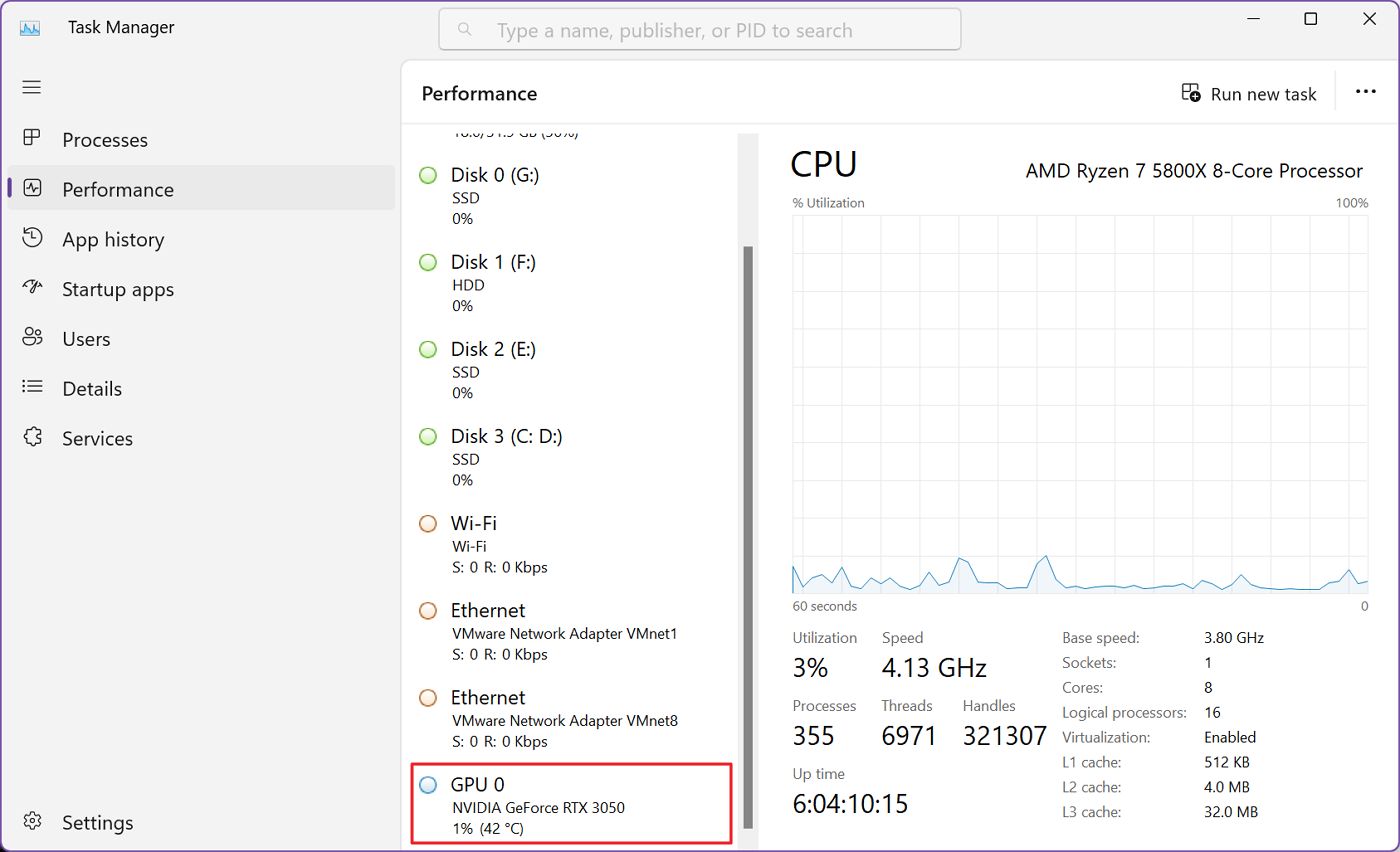
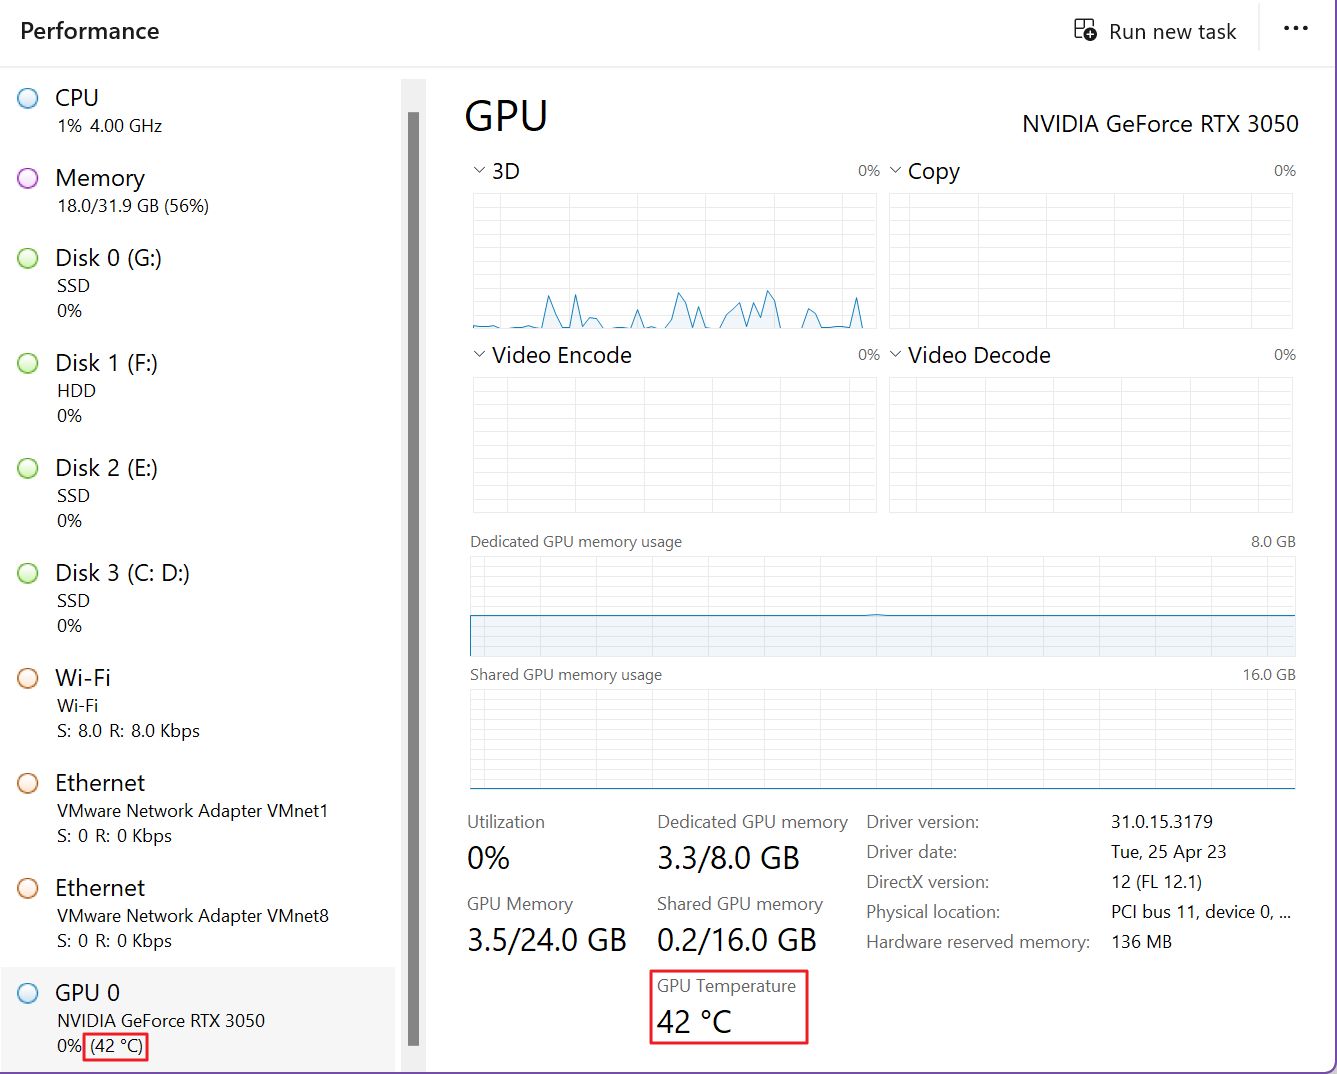
5. Here’s what the detailed GPU page looks like in the Task Manager. The current temperature is listed at the bottom, under GPU temperature (doh), next to VRAM usage and available VRAM size.
Note that the GPU temperature might also be displayed under GPU 0 or 1 in the middle column, without a need to click to see the details.
Note: On laptops and systems with two GPUs it’s possible that the temperature reading of the dedicated GPU is only shown when the GPU is active. For battery conservation reasons the sensors may be completely shut off when the chip is not running.
Also, most integrated GPUs will not display any kind of temperature reading. To get an idea of how hot they are just look at the CPU temperature.
The reading you see in the Task Manager is the current temperature. There’s no possibility, as of now, to include a temperature graph in the Task Manager. For more advanced monitoring it’s always recommended to install a third-party app.
This brings us to the next section of the article:
Check Current GPU Temperature and See a History Graph in Windows 10 and 11 With GPU-Z
If you want more detailed stats, or you’re running Windows 10, which doesn’t include temperature monitoring in the Task Manager, one of the apps I always recommend for monitoring is GPU-Z.
GPU-Z is free to download and use, it’s updated regularly, so even if you own a new shiny GPU, it will probably be supported by the app.
1. Download GPU-Z, install/unpack and start the utility.
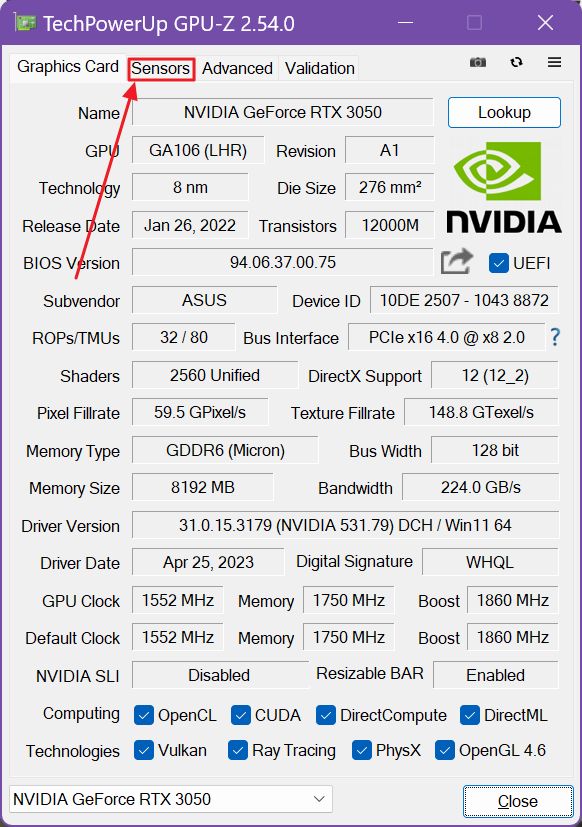
2. The first screen you see will display the important characteristics of your GPU. If you have installed more than one GPU in your system (or use a CPU with an integrated GPU) use the filter at the bottom of the page to switch between them.
Find the Sensors tab at the top of the screen, click to switch to the monitoring panel.
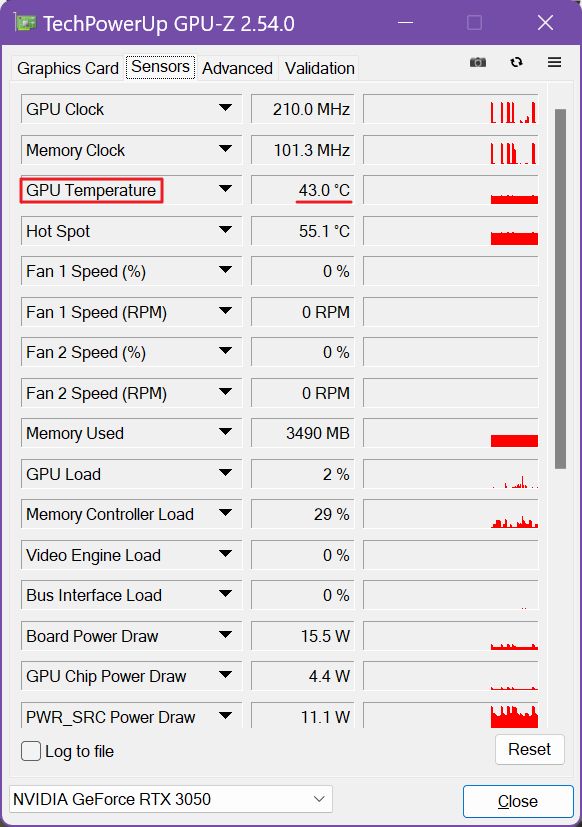
3. The third item in the Sensors tab is GPU Temperature. The current temperature is displayed in the middle column. The right column features a time graph (since you opened the GPU-Z app).
Hover the mouse over the graph to see the probed temperature at that time (it will replace the middle column current value).
Both Windows Task Manager and GPU-Z are using the same sensors for monitoring, so both methods are equally precise.
For most people, the Task Manager from Windows 11 is good enough for this task. For people who want more GPU-Z is the alternative I recommend.
Use HWiNFO for System Tray GPU Temperature Monitoring, Floating Graphs, and Lots of Data
Now, if you’re like me and want to get as much data as possible you have to use something like HWiNFO.
HWiNFO is free and a bit intimidating, as it pulls monitoring data from a lot of sensors. A lot!
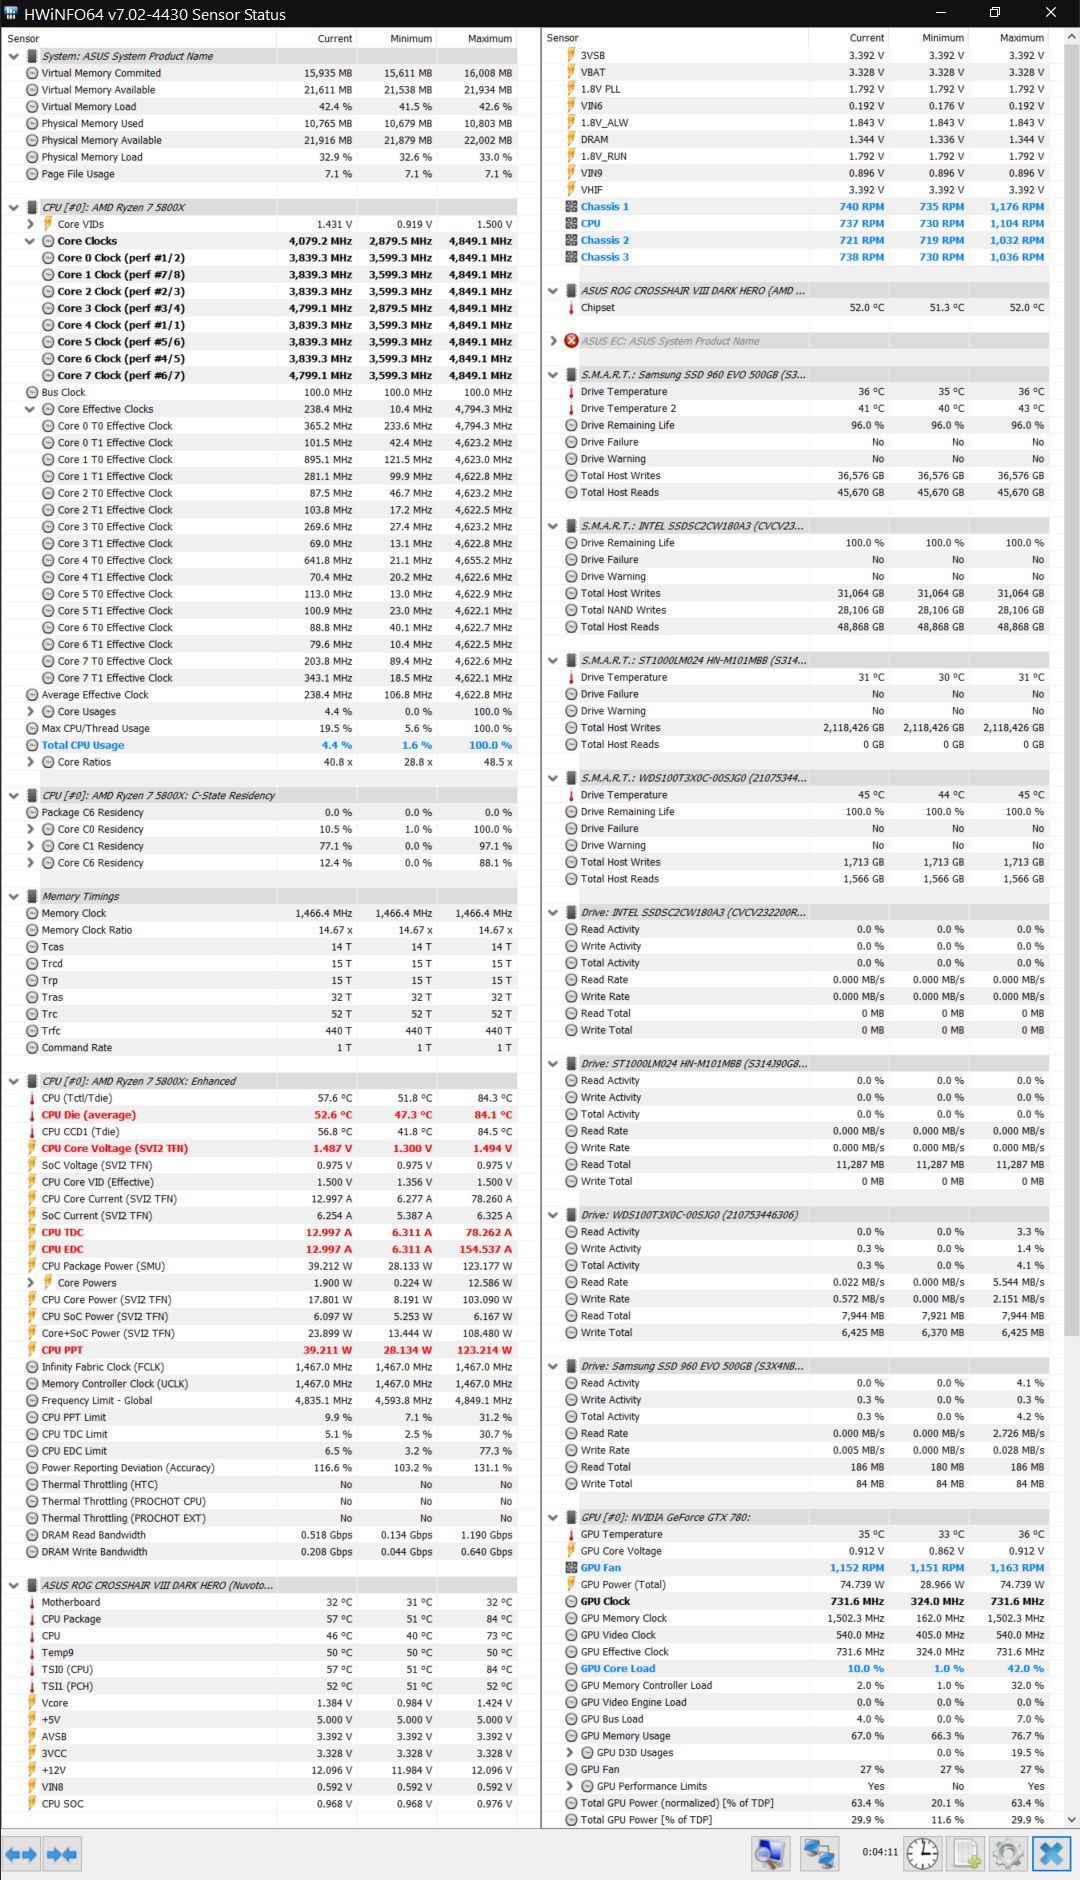
Don’t worry, I’ll show you what you need to find in this wall of text. Scroll toward the end of the HWiNFO sensor list until you see the heading GPU [#0] followed by your GPU model.
If you have two GPUs you’ll find a GPU [#1] section after the first one. In my case, for my GeForce RTX 3050, there are more sensors than you would see in the Task Manager.
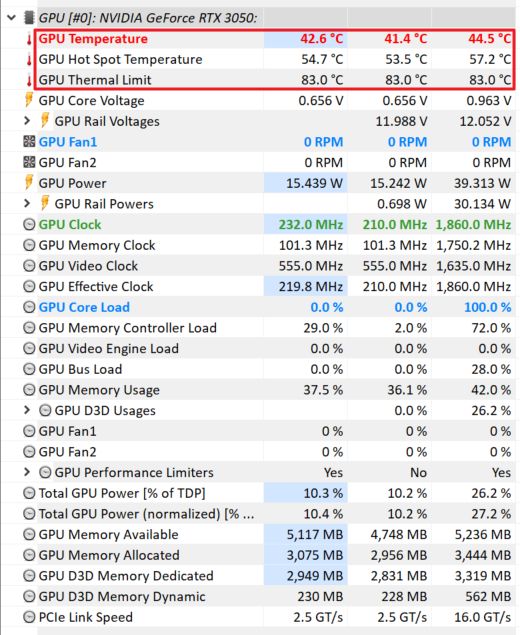
There’s also a mention of the GPU Thermal Limit, which is 83 degrees Celsius (181 Fahrenheit). This is the maximum operating temperature for my GPU.
Anyway, if you right-click on any sensor you want to monitor constantly and select either Show Graph or Add to tray.
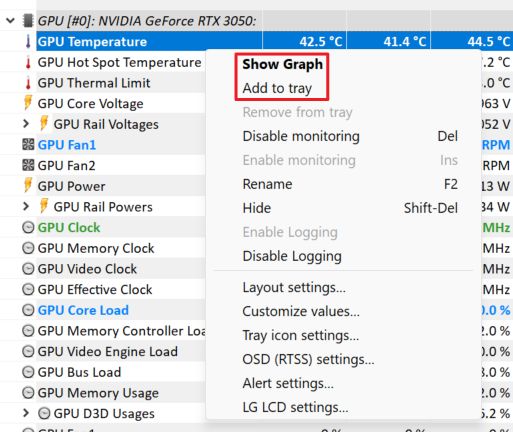
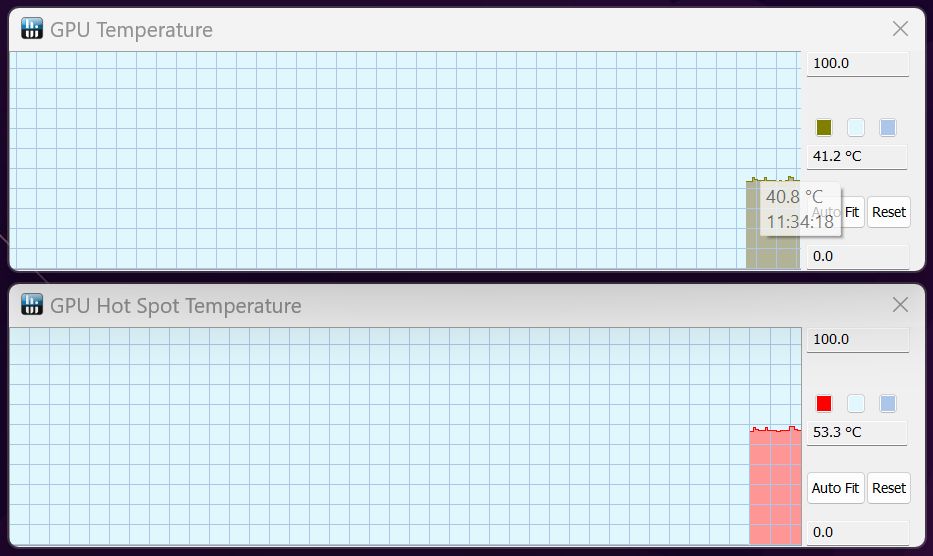
The Show Graph option will pull out a floating window that you can move anywhere you see fit on your desktop.
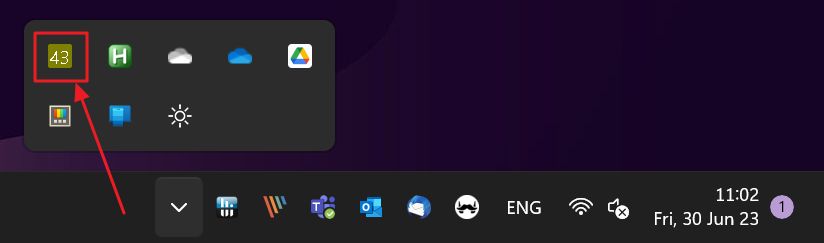
The Add to tray option will add the current temperature indicator to the System Tray, where you can easily monitor what’s happening. It’s even possible to change the coloring of the temperature icon to distinguish it from other monitored sensors (text and background color).
I quite like this option, but I recommend you don’t overcrowd the System Tray. In my case, I already have a bunch of apps adding their own icons there.
Frequently Asked Questions:
Currently, GPUs start to throttle(slow down) by design when they reach temperatures in the high 80 degrees Celsius (over 176 Fahrenheit). These temperatures vary with the chip manufacturer, so check their website for exact numbers.
When hitting the temperature limit the GPU will slow down, so ideally you should stay around or under 80 degrees for maximum performance.
Normal IDLE temperatures depend on your system cooling and tend to be higher on laptops. You should expect IDLE GPU temperatures at around 40-50 degrees Celsius (104 – 122 Fahrenheit).
In a modern GPU, the temperature is monitored constantly and the chip will automatically slow down as it approaches and reaches the GPU Thermal Limit set by the manufacturer.
This is called throttling and will impact performance if the GPU has serious issues with cooling (bad ventilation, cooler mounting pressure etcetera).
If you manage to keep the GPU temperature lower the operating frequency will boost automatically thus increasing performance. It’s all done automatically, so no user intervention is required.